

With the launch of BubbleProtection.com, joining BeatTheBubble.com in a new market for “bubble insurance” for poker tournaments, which of these services is better for players’ needs? Are either of them worth serious consideration by professional players for either expected value or bankroll management reasons? Or is the idea, as it might seem, mostly a gimmick or an appeal to a dubious psychological comfort – after all, as far as the frustration of bubbling a tournament is concerned, by purchasing bubble insurance, one is really only shifting to a new bubble.
Comparing The Two Services
Beat The Bubble, the first entry into this niche market, offers different “bubble cover” contracts based on how many additional spots a player would like to hedge against; customers can choose to add one, two, or three extra personal payout spots beyond the true bubble to a tournament in which they are playing. Though the website does not publish its formula for determining premiums and payouts, trying out different options in their calculator shows a clear pattern in their current pricing: the cost of the policy is equal to 5% of the tournament buyin for the 1-spot cover, 7.5% for the 2-spot cover, and 10% for the 3-spot cover. The payout of each contract is up to 125% of the tournament buyin, based on an unpublished formula depending on the number of entrants. All 1-spot covers will pay the full 125% of the tournament buyin once there are at least 25 players. The 2-spot covers do the same for fields of at least 34 players, and the 3-spot covers do the same for fields of at least 38 players. Since these player number thresholds are low for the scope of multi-table tournaments, we can assume that the maximum 125% payout will be available for any tournament big enough to compel a player to buy insurance.
BubbleProtection has a simpler contract structure. The cost of the policy is always 12% of the tournament buyin, the number of covered spots beyond the true bubble is equal to 10% of the field, and the policy pays out 100% of the buyin if you finish in a covered spot.
Both services appear to be available for any level of stakes. Neither appears to attempt to vary pricing based on play skill. One might assume that, since these sites charge the same rates for good players as bad players, they must have set their pricing in a way such as to prevent even the strongest players from using their services to derive a profit. Let’s take a look at the expected values of each type of contract.
Expected Values for Break-Even Players
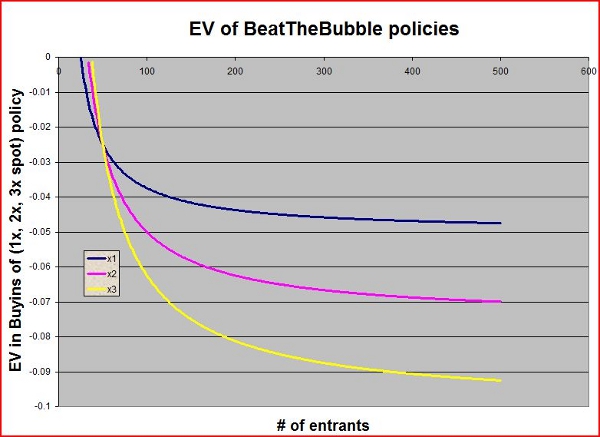
If we assume that every player in a tournament finishes in each position with equal probability, then the expected cost of Beat The Bubble’s policy depends on the number of entrants in the tournament. The larger the tournament is, the worse the Beat The Bubble policy is, as it awards no extra coverage spots or extra payoff for larger fields, yet the probability of finishing in a covered spot decreases. This chart shows the expected value of each of the three available Beat The Bubble policies, using tournament buyins as the units, shown as a function of field size:

So, for the break-even player, the policy is priced approximately fairly only for field sizes very near the thresholds of 25, 34, and 38 players, respectively. In practice, there may be few tournaments that run with such precisely-small field sizes, though one could certainly try to game the system by only purchasing insurance for tournaments that happen to run with those particular field sizes. However, for the practical cases of most larger-field MTTs, the average player looks to be paying an extra “rake” of about 4-10% of the tournament buyin in exchange for this insurance.
BubbleProtection, on the other hand, has a less-variable expected cost. The policy costs 12% of the tournament buyin and has an approximately 10% chance of paying off 100% of the tournament buyin, so the expected cost of the policy is about 2% of the tournament buyin. The probability of payoff can be affected by the presumed rounding down the number of covered spots in tournaments whose field sizes are not a multiple of 10; this can reduce the payoff probability to as little as 5.2% for extremely small field sizes, but the payoff probability will always be at least 9% for the break-even player for field sizes over 90 players. This reduces the expected cost of the policy to as much as 6.7% of the buyin for small tournaments, but to roughly 2-3% as the field sizes get larger.
Therefore, BubbleProtection offers significantly better expected value than Beat The Bubble for tournaments of approximately 100 or more players, but Beat The Bubble will roughly be a better deal for tournaments in the narrow range of 25-50 players, depending on choice of policy. Of course, a break-even player will not be able to derive a positive expected value from these contracts.
Expected Values for Winning Players
If we expand our analysis to include players with edges over the field, it becomes possible for these policies to have a positive expected value. The expected value of each policy will depend upon the skill level of the player. In general, it is probably reasonable to assume that a more skilled tournament player should be expected to finish in the “new bubble” positions more often, though it’s at least theoretically possible that a player could be exceptionally good at placing highly in tournaments while finishing in the middle of the pack less often. For the purposes of these approximations, we’ll assume a particular, increasing shape of the finish probability distribution, which I derived here.
Choosing between the two different companies as the field size dictates, the cost of the insurance for the breakeven player is roughly 2-3% of the buyin size. In the case of the BubbleProtection policy, a player that can finish in the covered spots (equal to about 10% of the field) with better than 12% probability will be profiting from purchasing the insurance. Without analyzing real-world tournament finish data, it’s hard to generalize what ROI this might correspond to, and it would likely depend strongly on field size. Nonetheless, it should be reasonable to assume that an overall ROI slightly above 20% should be enough to increase the finish probabilities for the covered spots by 20% (from 10% to 12%).
For Beat The Bubble policies, since the payoff of the policy is 125% of the buyin, rather than 100%, a player will not need to finish in the covered spots as far above parity as for the BubbleProtection policies.For example, in a 40-person field, in order to overcome the roughly 2% extra “rake” of the insurance premium, a player would have to finish in the covered spot(s) under the 1-spot, 2-spot, and 3-spot policies with probabilities of 60%, 20%, and 6.7% above par. The higher the percentage of covered spots in relation to the field size, the less of an edge is necessary for a policy to be +EV. However, as noted before, this is likely very sensitive to field size, and the Beat The Bubble policies will only be reasonably-priced for small field sizes since the number of covered spots does not scale with field size.
The Value of Variance Reduction
Do the “insurance” side of these contracts offer any significant reduction in variance for the tournament player that would impact bankroll requirements or personal risk aversion? To approximate this, we look at two example tournaments, a 40-player MTT under the Beat The Bubble policies and a 200-player tournament under the BubbleProtection policy. For the payout structures of each, I have used Full Tilt Poker’s default tournament payouts, assuming that 10% of the tournament buyin is taken in rake.
For the 40-player tournament, the standard deviation without any insurance seems to be on the order of 250%-400% of the tournament buyin, varying for different levels of skill/ROI for the player. The amount of reduction to the standard deviation afforded by the 1-spot, 2-spot, and 3-spot policies look to each be under 1% of a buyin for the near-break-even player. For a player with a ROI near 50%, the reductions to the standard deviation are about 1%, 2%, and 3% under the respective policies. The reduction gets higher for players with higher ROIs, and the 3-spot policy always has the greatest reduction, but the reduction could never realistically exceed 10% of a buyin.
For the 200-player tournament, a typical standard deviation is about 500%-700% of a buyin, and the reduction to the standard deviation by the bubble insurance, even though the BubbleProtection policy covers 20 spots, is still on the order of 1-5% of a buyin.
Therefore, under any reasonable circumstances, the reduction to standard deviation of these policies is likely very small, on the order of only about one percent of the total standard deviation. There are no substantial advantages of bubble insurance policies to bankroll management or risk-averse utility preferences. In practice, the expected value considerations of each of these contracts would likely dominate any variance reduction effects.
Conclusion
For a sufficiently-profitable tournament player, between the two providers of bubble insurance, there should be an opportunity to enter a policy that is, if not +EV, nearly +EV.A solid winning MTT player with an ROI around 20-30% is probably close to indifferent between buying a policy and not, and players of significantly higher relative skill to their fields may be able to pick up some small but meaningful expected gains by purchasing insurance from these companies.
Customers should be skeptical of these services being presented as being of any meaningful value to bankroll management. These companies may have to tweak their pricing to account for the potential adverse selection of only good players pursuing their services, if the market for this type of service even manages to catch on at all. Overall, the idea of bubble insurance may feel appealing, but, as is often the case with tournament bubbles, the psychological and emotional perception far outweighs the real impact on decision-making.

