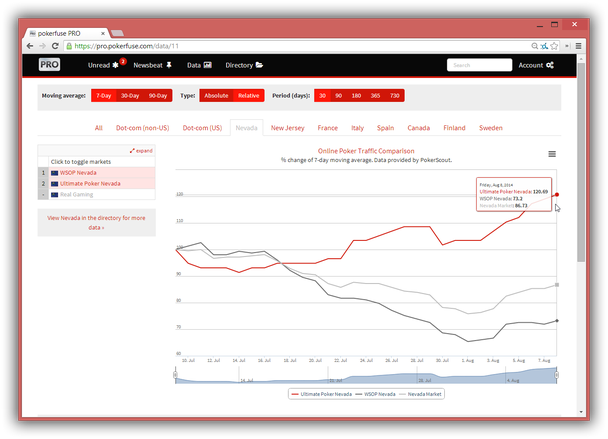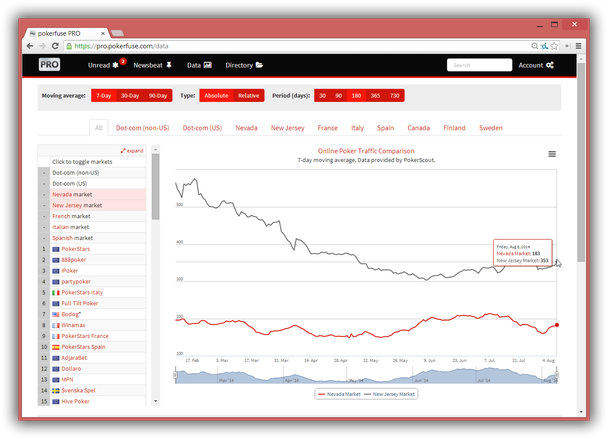
- Up to five networks and markets can be compared on a single graph.
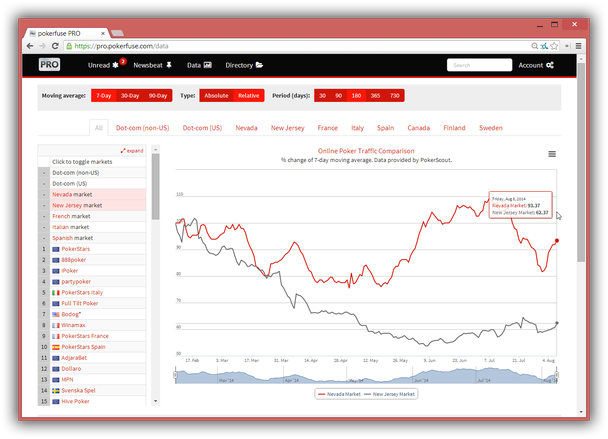
- Relative graphs allows you to look at changes over a set period of time.
The first Inside PRO article on PRO Data introduced the Data homepage and explained network indicators and how to switch between markets and different view settings.
This second installment looks at one of the most powerful features of a Data subscription—comparing networks and markets.
Selecting One or More Networks
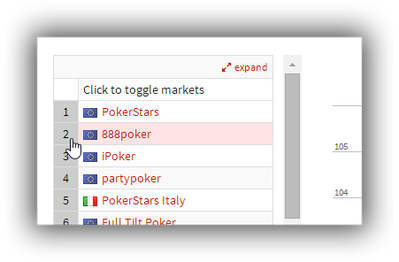 To look at the Data of a single network, simply click on the ranking numeral to the left of the network name.
Once selected, the row will highlight red to show its selection.
The graph on the right will immediately update with the cash game traffic of the selected network.
To deselect a network, simply click again on the far left column.
Up to five networks can be selected at any time—the graph will update to show each selected network. A key below will show the graph legend to identify each network, or hover over a point on the graph to see a data popup.
Comparing markets
The same selection can be performed on markets. Each market is an aggregate of all tracked networks in that market. So “Nevada,” for example, combines the cash game traffic of WSOP, Ultimate Poker and Real Gaming. Markets can be compared with other markets and networks, all on one graph.
Markets must be revealed by clicking on the “Click to toggle markets” link at the top of the column listing the poker networks. This expands to show all main markets, including dot-com (US and non-US facing) plus all main European and US segregated markets.
Markets can be selected just like networks. Click on the left hand column to select; click again to deselect.
Relative Graphs
By default all graphs are absolute—that is, the Y axis is a 0-based scale of absolute cash game seats filled for each network or market graphed.
However, for market and network comparison, the relative graphing option—available as a switch at the top—should be explored.
When in relative mode, all lines on the graph start at a baseline of 100%, then move relative to this base-point over the given period.
The following graphs shows the relative performance of the Nevada and New Jersey online poker markets over the last 180 days. While the Nevada market is smaller, the graph shows that it has substantially outperformed its larger cousin: The New Jersey market is down to 62%— a 38% drop in the 180 period—whereas Nevada is down less than 7%.
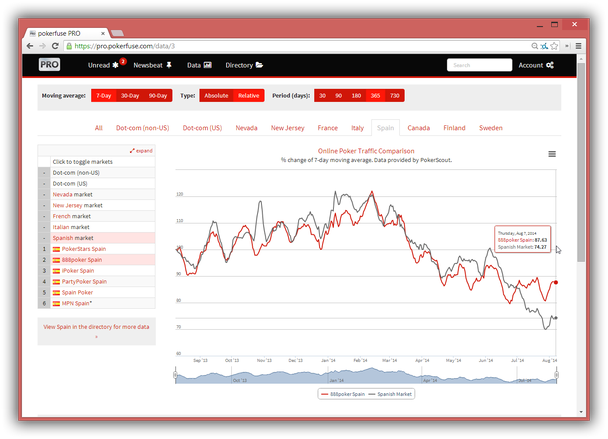
Relative comparison is useful not just for comparing markets, but for comparing relative networks, and networks vs their respective markets.
The graph below shows clearly how 888 in Spain has stayed in step with its market—but in the last few weeks, has managed to significantly outperform its competition.
This completes the tour of the PRO Data homepage—however, more fine-grained data is available in the Directory, with dedicated pages for each poker network, company and jurisdiction. Forthcoming Inside PRO articles will cover these topics in detail.

